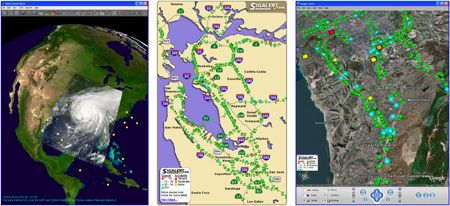
Data Integration with NASA World Wind and Google Earth

The left screenshot shows an MODIS (Moderate Resolution Imaging Spectroradiometer) overlay of Hurricane Katrina as of August 29, 2005. The map in the center displays Sigalert.com, a service that aggregates real-time traffic data from the San Francisco Bay Area. The screenshot on the right exemplifies the idea of a mash-up, using the Sigalert traffic data to project symbols for accidents and current traffic speeds onto the Google Earth representation of Southern Los Angeles.
Source: Chapter 1, page 5.

The Geospatial Web ▪ Copyright 2007 Springer ▪ ISBN: 1-84628-826-6


